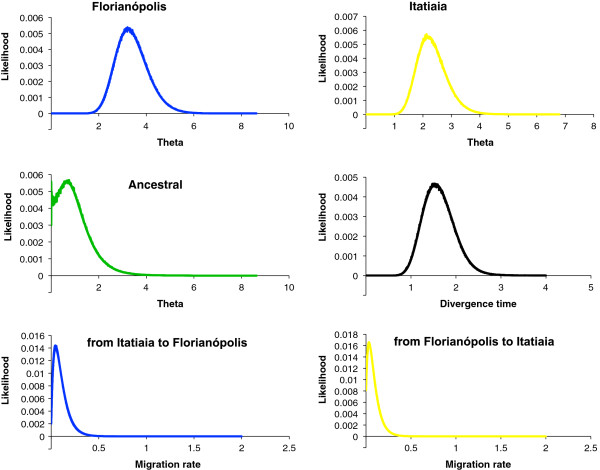
Figure 1.
Posterior probability distributions for each of the six demographic parameters estimated using IM for the pairwise comparison Florianópolis vs Itatiaia (A and B). Effective population size for an ancestral and two descendent populations (theta), divergence time between Florianópolis and Itatiaia, and migration rates in both directions. Four IM simulations using different seed numbers were plotted for each parameter estimate (see also Additional file 4: Table S4). All curves are shown including the range of the priors.

