
Figure 4.
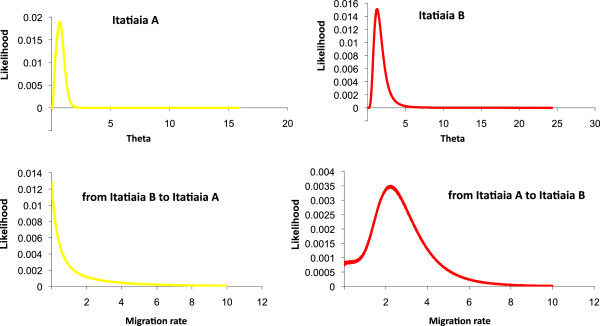
Posterior probability distributions for each of the four demographic parameters estimated using IM for the pairwise comparison Itatiaia A vs Itatiaia B. Effective population size for Itatiaia A and Itatiaia B (theta) and migration rates in both directions. Four IM simulations using different seed numbers were plotted for each parameter estimate (see also Additional file 5: Table S5). All curves are shown including the range of the priors.