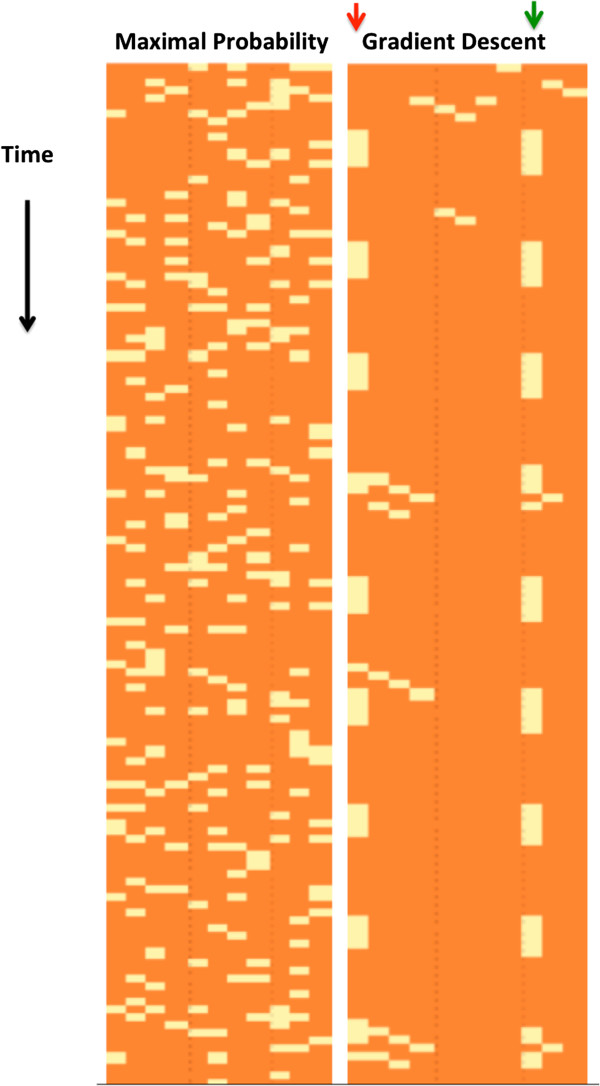
Figure 9.

Maximal probability reconstruction vs. gradient descent reconstruction. Maximal probability reconstruction vs. gradient descent reconstruction of the trajectory of the yeast cell cycle network of Li et al. [16]. Rows correspond to the time points and columns to network nodes. For display purposes only a prefix of the trajectory is shown. The yellow color represents mistakes, i.e., values different than the real Boolean values, and orange represents a correct value. The maximal probability reconstruction is presented to the left of the gradient descent reconstruction. Overall, the gradient descent is more accurate than the maximal probability reconstruction. The percentages of wrongly reconstructed values for the latter method are 17.9%, and for the gradient descent reconstruction, 7.4%. The gradient descent algorithm makes more mistakes for the node Cln3 that has no regulators and receives an external input (red arrow) and for the MBF that has Cln3 in its regulator set (green arrow).
