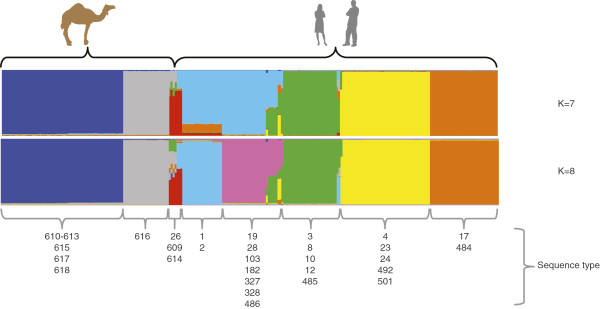
Figure 3.

Population structure of 92 East African camel GBS and 169 Kenyan human GBS. The populations revealed by the STRUCTURE analysis using the linkage model and sequences from 7 house-keeping gene fragments are displayed below the figure and marked with different colours, the hosts are displayed above. The ancestral parts of each isolate are displayed in vertical lines. The STs are displayed for every population.
