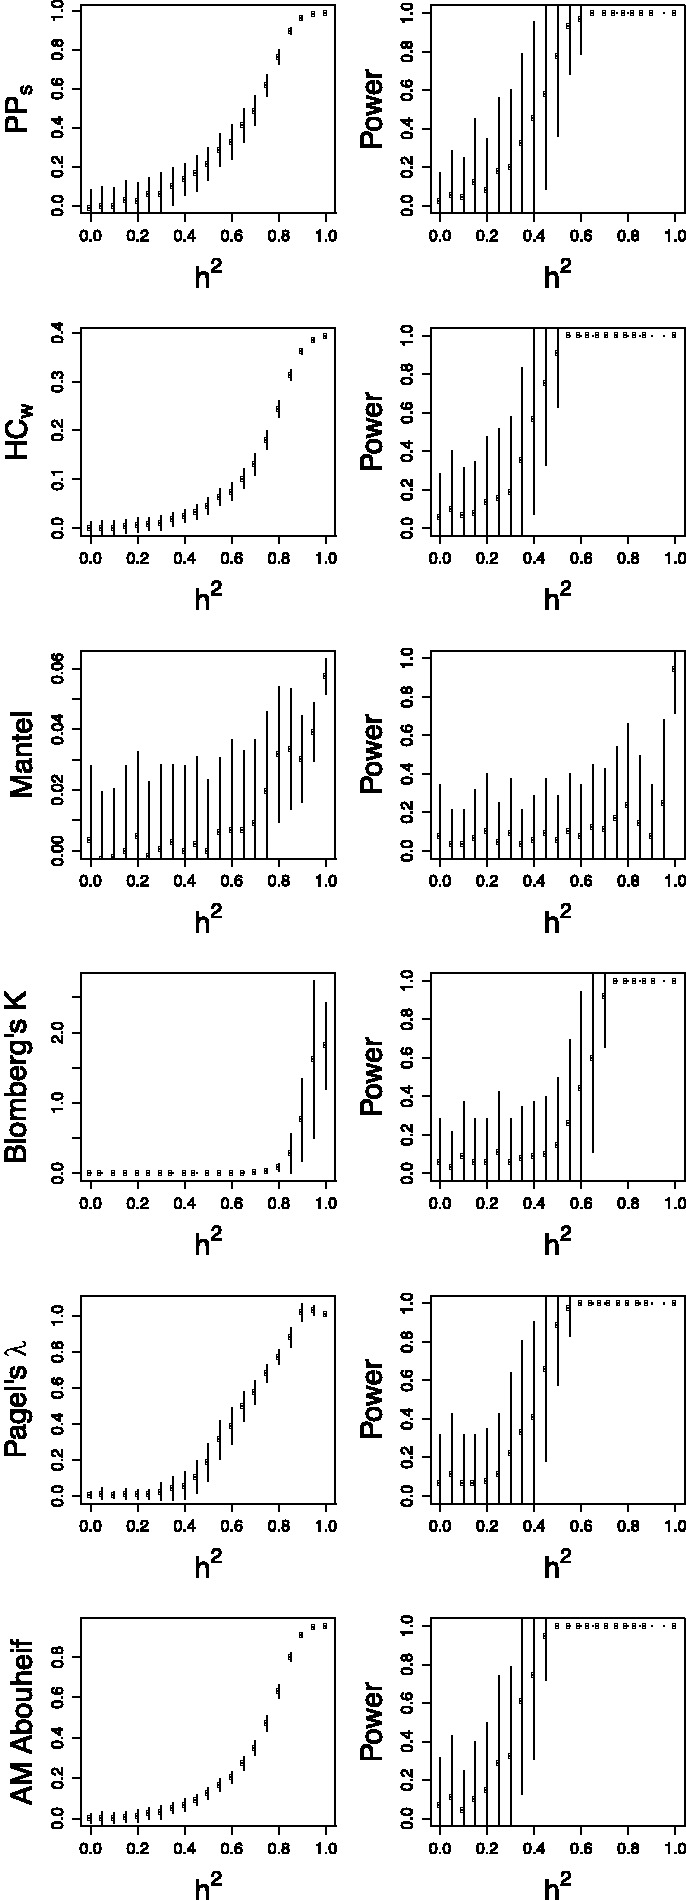
Figure 3.

Comparison of the sensitivity of various statistics to heritability on the entire Swiss phylogeny. (Left side) The relationship between heritability and six different statistics under comparison. The circles and bars represent the mean and standard deviation of the sample. (Right side) The power of each statistic to detect heritability at 5% significance. The bars represent the standard deviation of the proportion
