
Table 2.
The statistics (Z), P-values from a randomization test, medians and confidence intervals of h2 from MHT on the Swiss data
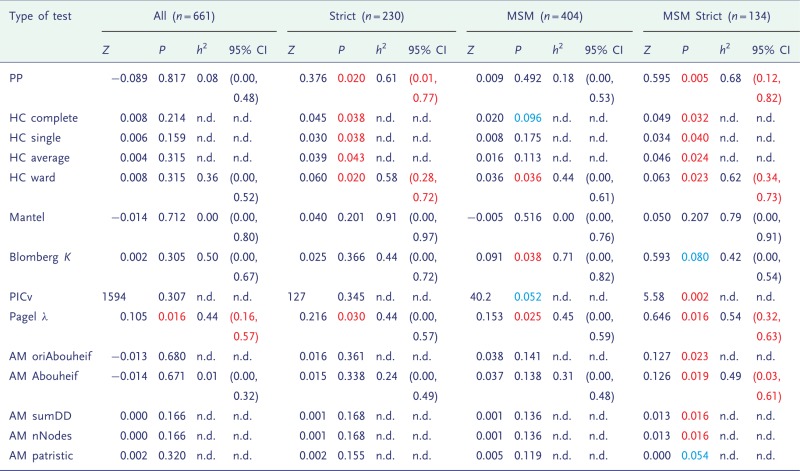 |
Individuals were subdivided according to variability of viral load (Strict), risk category (MSM) or both. P-values showing borderline significance (P <0.1) are in blue, and formal significance (P <0.05) is in red, and confidence intervals in which the lower limit is above zero are also in red. n.d., not done.