Figure 3.
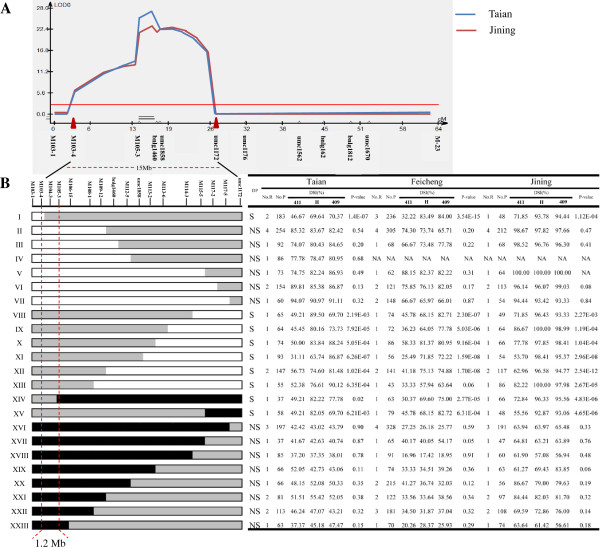
Mapping qMrdd1. A. Diagram of QTL plots for qMrdd1 in 211 BC1F2 families. The logarithm of odds profile, the relative position of qMrdd1, and relevant markers are displayed using QTL cartographer version 2.5. B. Fine mapping of QTL-qMrdd1 based on recombinant progeny. One hundred and one BC1F3 recombinants fell into 23 types based on their genotype at 17 markers. The genetic structure of each type is shown. Black, gray, and white rectangles correspond to homozygous NT411 alleles, heterozygous NT409/NT411 alleles, and homozygous NT409 alleles, respectively. Self-pollinated progeny of these BC1F3 plants were genotyped using markers within the heterozygous region, resulting in three genotypes of progeny. Details concerning the number of recombinants that were planted, the number of progeny that were planted, and the DSI of all three genotypes of progeny are listed in the table. Significant differences (P < 0.05) among the three genotypes indicated that qMrdd1 localized to the heterozygous region and that their parental recombinant(s) was segregating (S). An insignificant difference (P≥0.05) among the three genotypes suggested that qMrdd1 localized to the homozygous region and that their parental recombinant(s) was not segregating (NS). Analysis of both genotype and phenotype for all recombinant types enabled the positioning of qMrdd1 within a 1.2-Mb region between markers M103-4 and M105-3. DP: deduced phenotype, LOD: logarithm of odds, No. R: number of recombinants, No. P: number of progeny, NA: not available, 411: progeny with a homozygous genotype the same as the MRDD-resistant parental line NT411, H: progeny with a heterozygous genotype, 409: progeny with a homozygous genotype the same as the MRDD-susceptible parental line NT409.

