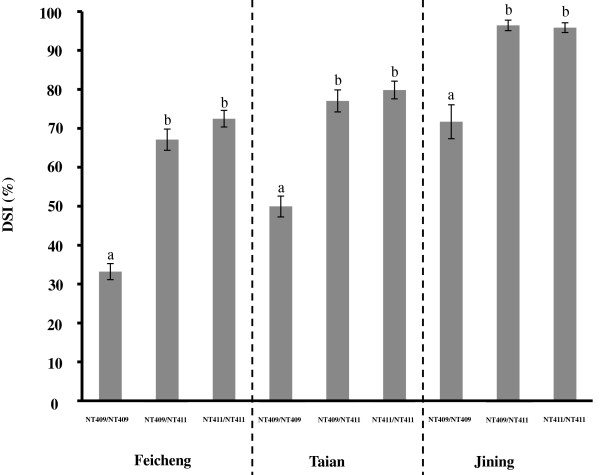
Figure 4.
Effect of QTL-qMrdd1 on BC1F4 populations across three experimental sites. BC1F4 populations were divided into three genotypes (NT409/NT409, NT409/NT411, and NT411/NT411) according to genotypes within the qMrdd1 region. Average DSI values are shown. Error bars indicate s.e.m. Multiple comparisons between genotypes were analyzed using SAS 9.1 PROC general linear model with Tukey’s adjustment.

