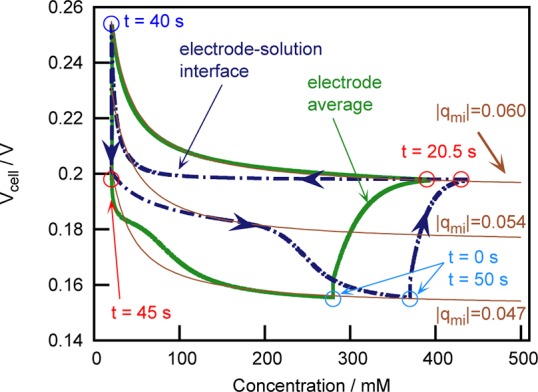
Figure 4.

Thin solid lines, bottom to top: cell voltage versus salt concentration relations for |qmi| = 0.047, 0.054, and 0.06. Dashed-dotted and thick solid lines: simulated CAPMIX cycle in Figure 1, showing the evolution of the cell voltage with the salt concentration at the macroscopic electrode–solution interface (which determines the position x = 0) and average concentration in the electrode, respectively. Circles locate the initial state of each step, starting at the indicated times.
