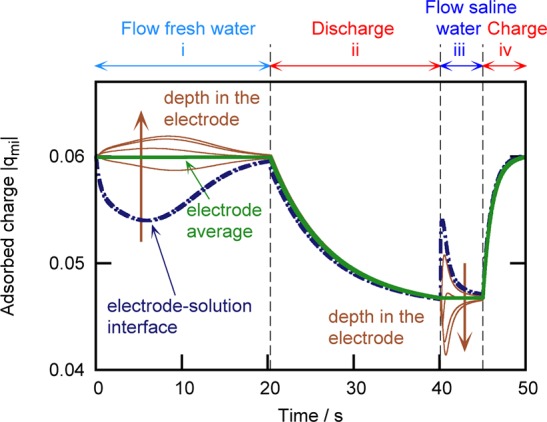
Figure 5.

Time evolution over one of the CAPMIX cycles in Figure 3 of the adsorbed charge density at different depths in the electrode. Dashed-dotted line: |qmi| at the macroscopic electrode–solution interface, which determines the position x = 0. Thin, solid lines, in the order determined by the arrow: x = 0.25 Le, 0.5 Le, 0.75 Le, Le.
