
Figure 1.
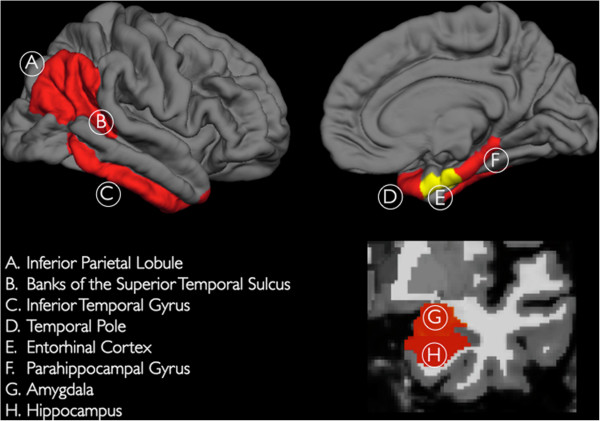
Three-dimensional representations of the neuroanatomic regions examined in the current study (only one hemisphere is shown). All of the examined neocortical regions are illustrated in the lateral and medial views of the gray matter surface (top row). The two non-neocortical regions (i.e., the hippocampus and amygdala) are illustrated in the coronal view of a T1-weighted MRI image (bottom row). Regions illustrated in red constitute the 'AD-vulnerable ROI’ (for further details please see manuscript text).