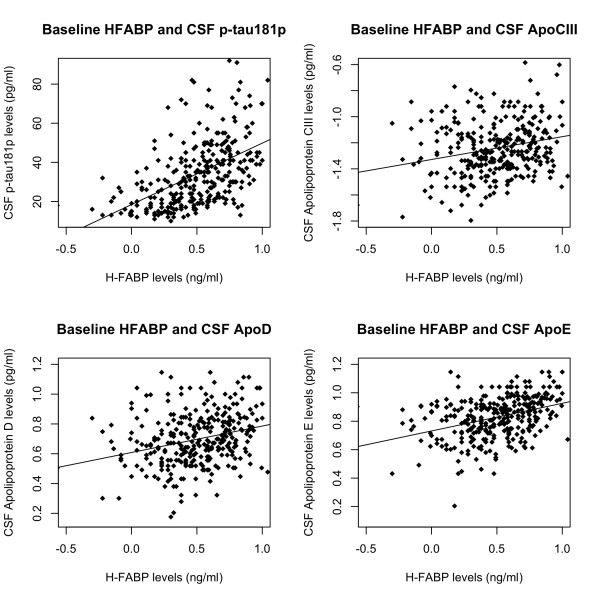
Figure 3.
Scatter plots demonstrating the relationship between baseline CSF levels of HFABP (quality-controlled, transformed values as described in reference 18) CSF p-tau181p (top left), CSF ApoC III (top right), CSF ApoD (bottom left) and CSF ApoE (bottom right). The black line represents the best-fit regression line.

