
Figure 3.
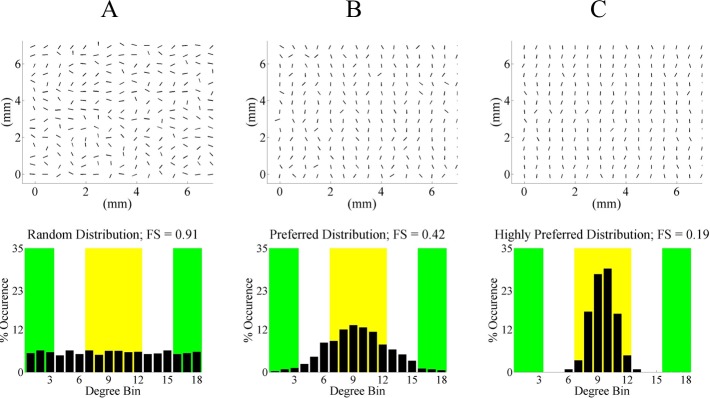
Vector plots of local preferred fiber angles and their corresponding histograms for three hypothetical cases to illustrate the possible values of FS. The green ranges indicate equatorial alignment, and the yellow range represents meridional alignment. Note that all bar graph values in each distribution add up to 100% because the end point is normalized to the total number of light splays analyzed in the tissue slice. (A) No preferred orientation, resulting in an FS ≈ 1. (B) Preferred fiber angle orientation. (C) Highly preferred fiber angle orientation with an FS smaller than (B).