
Figure 6.
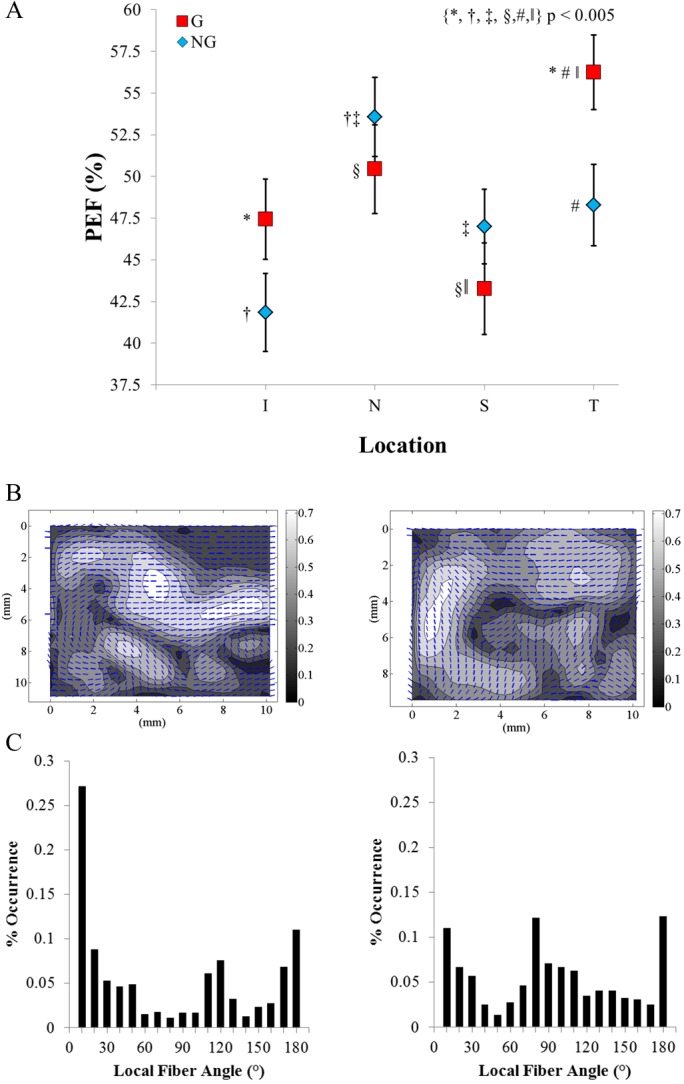
(A) A comparison of the glaucomatous and nonglaucomatous groups' PEF binned means as a function of region on the posterior sclera. (B) Representative vector-contour plots from depth bin 2 of the left temporal region from glaucomatous donor G4 and nonglaucomatous donor N5. The overlaid vectors show the local preferred fiber direction, and the contour values show the local Ecc. (C) The distribution of local fiber angles used to calculate the PEF. The PEF in G4 was 64.4%, as compared to a PEF of 44.6% for N5.