
Figure 2.
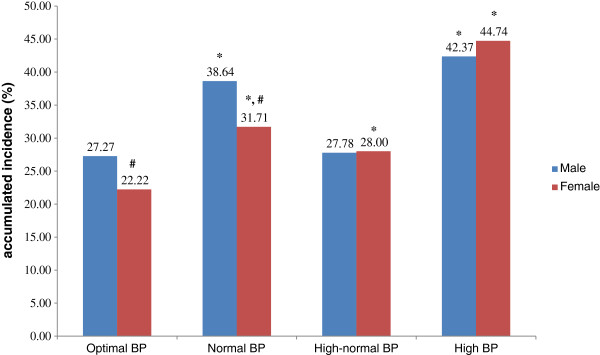
The accumulated incidence of MetS in subjects aged ≥50, stratified by gender and blood pressure level. *Compared with optimal BP group of same gender using χ2 test, P < 0.001. #Compared with male counterpart using χ2 test, P < 0.001.
Official websites use .gov
A
.gov website belongs to an official
government organization in the United States.
Secure .gov websites use HTTPS
A lock (
) or https:// means you've safely
connected to the .gov website. Share sensitive
information only on official, secure websites.
The accumulated incidence of MetS in subjects aged ≥50, stratified by gender and blood pressure level. *Compared with optimal BP group of same gender using χ2 test, P < 0.001. #Compared with male counterpart using χ2 test, P < 0.001.