
Fig. 3.
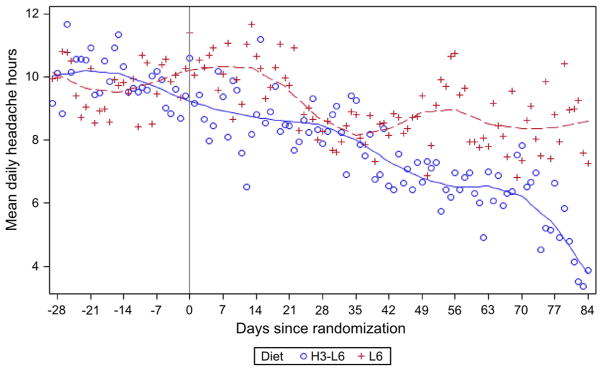
Mean daily Headache Hours by dietary intervention group. Graph depicts the average number of Headache Hours calculated for each day according to intervention group. A Loess smoothing procedure was employed to visualize trends. Participants in the 2 groups provided equivalent amounts of Headache Diary data after randomization (2145 total days of records in the L6 group and 2175 in the H3-L6 group).