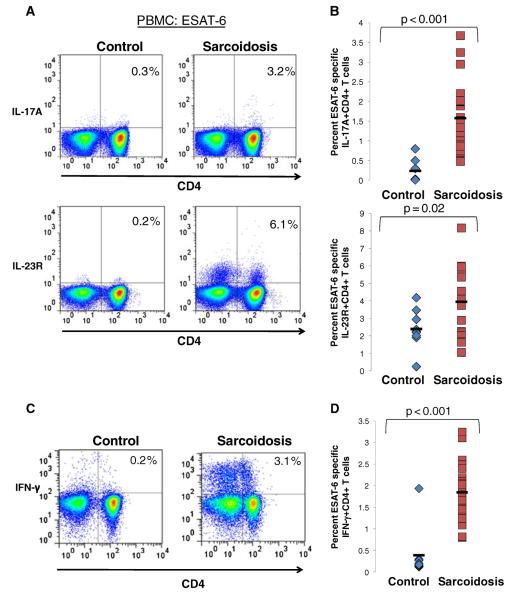
Fig. 3. Patients with sarcoidosis exhibit an ESAT-6 specific Th-1/Th-17 response.
a Representative plots of flow cytometric detection of production of intracellular IL-17A, surface expression of IL-23R and production of intracellular IFN-γ in CD4+ T cells from ESAT-6 stimulated PBMC of healthy controls and patients with sarcoidosis. b Frequencies of IL-17A+CD4+ and IL-23R+CD4+ from ESAT-6 stimulated PBMC of healthy controls (diamonds, n=9) and patients with sarcoidosis (squares, n=24). c Representative plots of flow cytometric detection of production of intracellular IFN-γ in CD4+ T cells from ESAT-6 stimulated PBMC of healthy controls and patients with sarcoidosis. d Frequencies of CD4+ T cells expressing IFN-γ from ESAT-6 stimulated PBMC of healthy controls (diamonds, n=9) and patients with sarcoidosis (squares, n=24). P values are indicated

