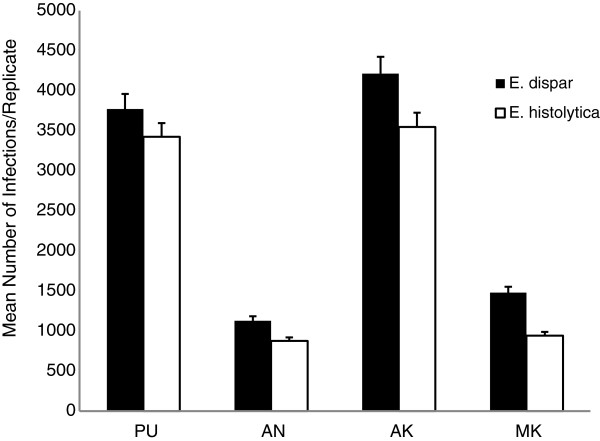
Figure 4.
Differences in modeled infection rates of E. histolytica and E. dispar, originating from four sites in Bali, Indonesia. Each analysis is the comparison of the number of infections occurring when modeling E. histolytica or E. dispar, by initial site of infection (PU: t = 27.0996, p <2.2e-16; AN: t = 2.5733, p = 0.01164; AK: t = 22.505, p <2.2e-16; MK: t = 2.7825, p = 0.006519). Standard error bars shown; d.f. = 199 for each site of analysis.

