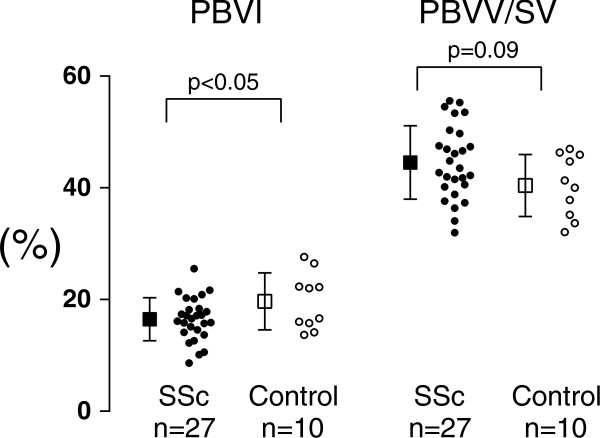
Figure 5.
PBVI and PBVV/stroke volume. Results for the pulmonary blood volume indexed to the lung volume (PBVI) and the pulmonary blood volume variation divided by the stroke volume (PBVV/SV), respectively, in percent. Open boxes and circles represent healthy controls (n = 10), and black boxes and circles represent SSc patients (n = 27). Circles represent individual data and boxes and error bars show mean ± SD. Note that there was no difference between healthy controls and SSc with regards to PBVV/stroke volume.

