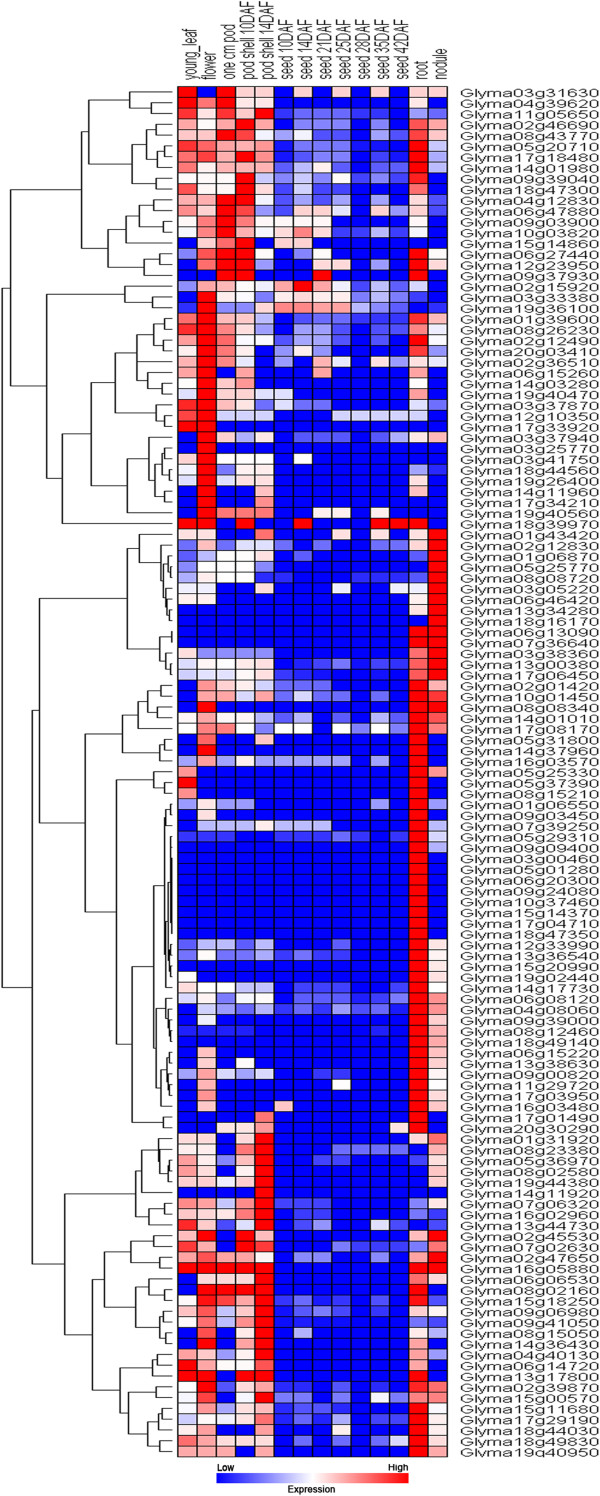
Figure 4.

Expression profiles of 127 soybean WRKY genes. The hierarchical cluster color code: the largest values are displayed as the reddest (hot), the smallest values are displayed as the bluest (cool), and the intermediate values are a lighter color of either blue or red. Pearson correlation clustering was used to group the developmentally regulated genes. Six genes were excluded from the analysis due to no expression in an organ or a period.
