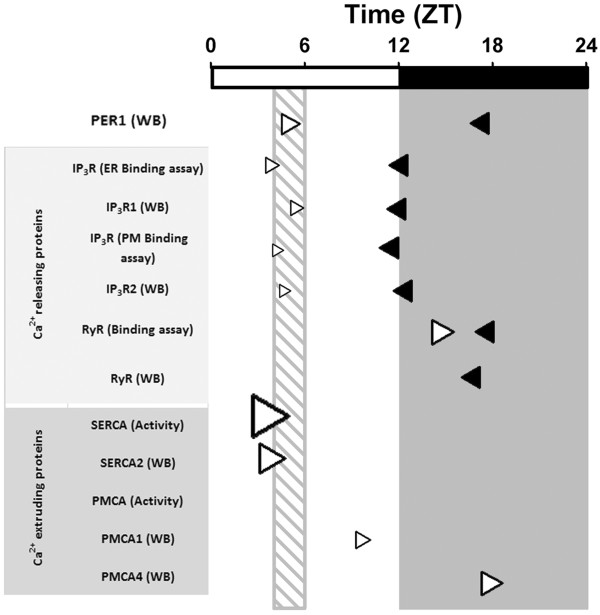
Figure 7.
Acrophase summary of hepatic calcium-handling protein daily rhythms. Times of peak activity and protein levels for each of the studied proteins are shown for the AL group (black arrowheads) and for the RF group (white arrowheads). The dark gray rectangle indicates the dark period, and the ZT time is shown above. Each arrowhead from the RF group was normalized with respect to its control, and its size indicates the amplitude of the daily rhythm in comparison to the AL group. The dashed rectangle shows the time of food access for the RF group. Calcium-handling protein activity or expression levels that did not show 24-h rhythmicity were omitted.

