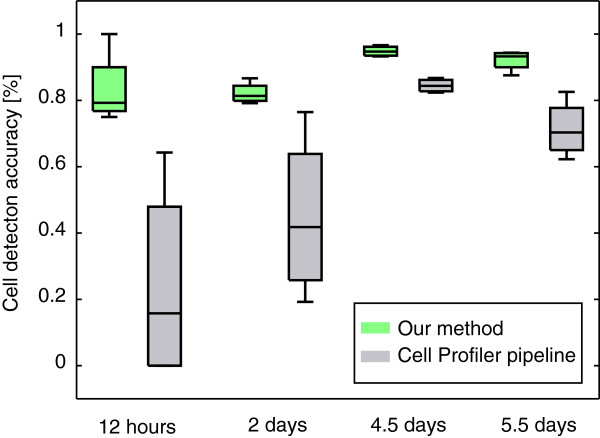
Figure 3.
Comparison of manually evaluated cell detection accuracy. Comparison of manually evaluated cell detection accuracy as described in Table 1 between our method (green boxplots) and the CellProfiler pipeline (gray boxplots). Especially at the two early time points, CellProfiler performs not very robust on the different fields of view. Note that the pipeline was parametrized to perform best on images at day 4.5. Thus, the pipeline might be able to perform well on images on the early time points, but is not robust enough with the given parameter settings.

