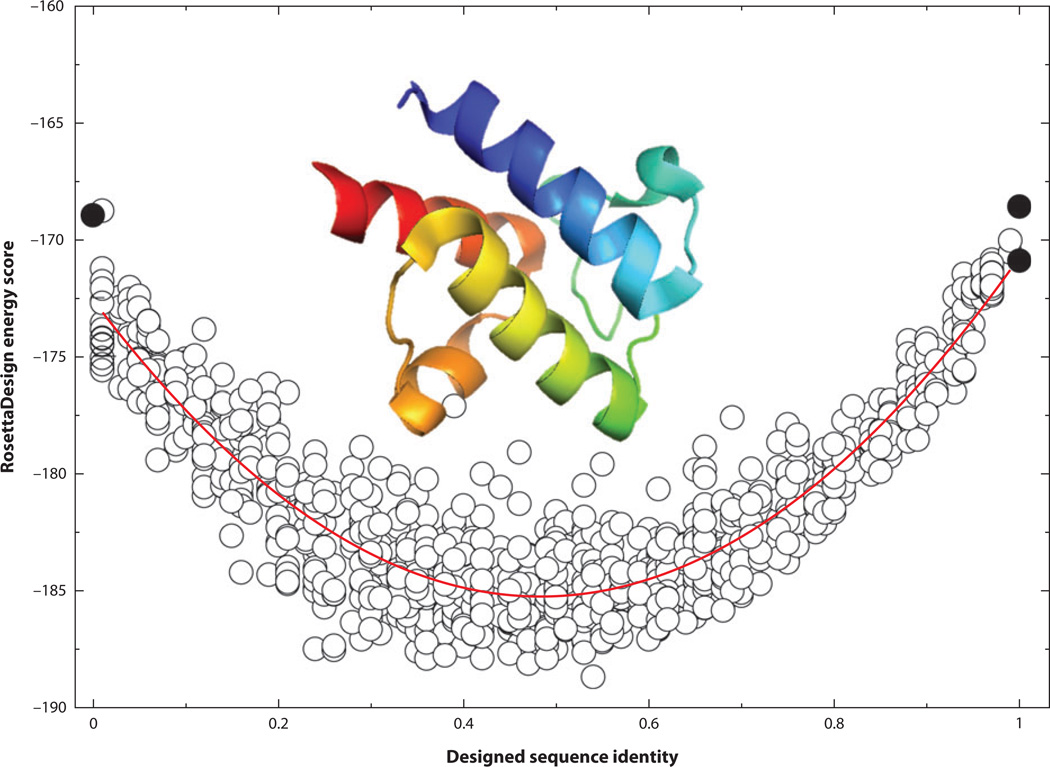
Figure 2.
The RosettaDesign energy score (RosettaDesign 2.3) as a function of sequence identity from the wild-type sequence of the acyl carrier protein from Thermus thermophilus HB8 (PDB ID: 1×3o). Different sequence identities were sampled by a harmonic restraint. The curved red line indicates the quadratic fit. Black circles at 100% sequence identity represent the energy value of the native structure with its wild-type sequence after side chain optimization from RosettaDesign (bottom), and the average energy value from 10 designed structures from RosettaDesign after fixing all residues to wild-type sequences without a harmonic restraint (top). The black circle at 0% sequence identity is the average energy value of 10 designed structures from RosettaDesign after excluding the type of wild-type amino acid residue at each sequence position without the harmonic restraint.

