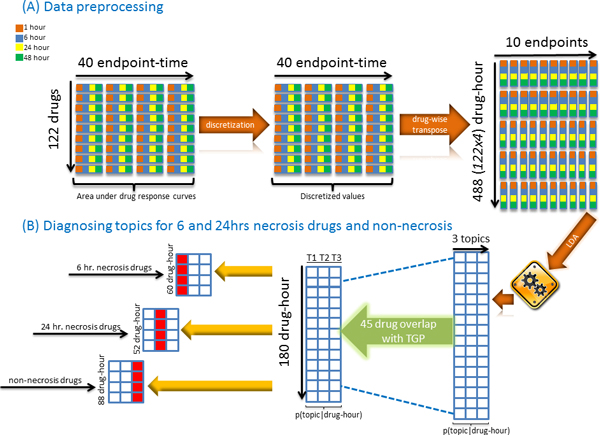
Figure 1.
Flow chart of the procedure of this study, from data processing to topic diagnosis. (A) steps include discretization and change in the orientation of the input matrix for LDA. (B) steps developed parameters for different class definitions in Settings I, II, and III (Table 1), and identified diagnostic topics for the 45 drugs in the in vivo histopathology dataset.

