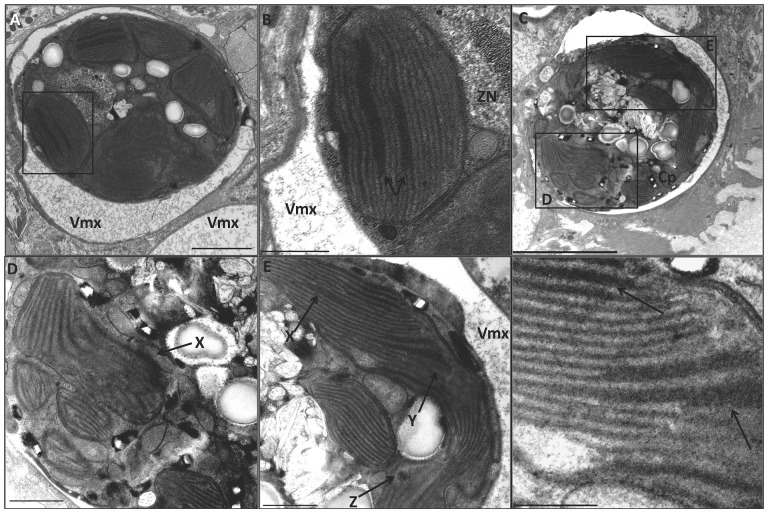
Figure 6. Transmission electron micrographs of a zooxanthella within the endodermal layer of the host coral P. damicornis exposed to 2007 µµµµµmoles/meter2/second PAR peak irradiance (high-light) at 25°C and 32°C.
Cp = chloroplast; MT = mitochondria; s = starch granule; VMx = Vacuolar matrix; Zn = Zooxanthella nucleus. (A) High-light at 25°C. Magnification 2000×, scale bar = 2000 nm. (B) Magnified area from boxed area in panel A. Magnification 5000×, scale bar = 1000 nm. Arrow indicates coalescence of thylakoid membranes. (C) High-light at 32°C. Magnification 2000×, scale bar = 2000 nm. (D) Magnified area from boxed area in C. Magnification 4000×, scale bar = 1000 nm. Arrow indicates diffused and disorganized chloroplast membrane zone. (E) Magnified area from panel C. Magnification 4000×, scale bar = 1000 nm. X-arrow indicates coalescence of thylakoid membranes. Y-arrow indicates diffusion of thylakoid membranes into the stroma. Z-arrow indicates inverted thylakoid membrane micelle. (F) Magnified area from box in panel E. Magnification 12000×, scale bar = 500 nm. Arrows indicate coalescence of thylakoid membranes.

