
Figure 3. Time course of aortic changes in Mgp−/− mouse aorta.
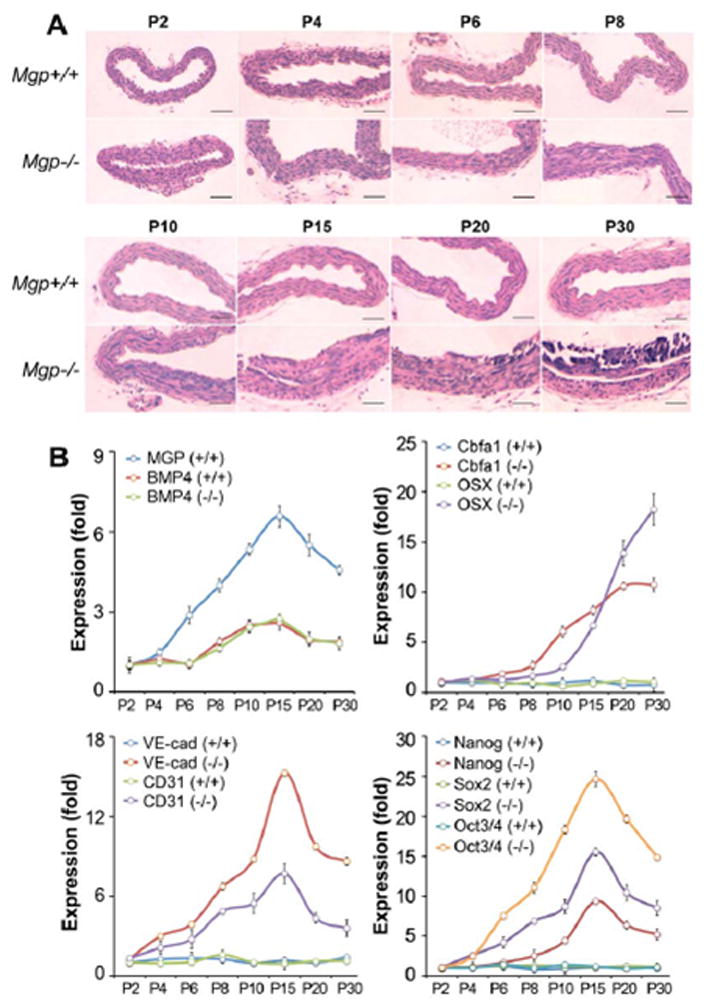
(A) Aortas were collected between postnatal day (P) 2–30 from Mgp+/+ and Mgp−/− mice as indicated, and stained with H&E. (B) Time course of aortic expression in Mgp+/+ and Mgp−/− aorta (P2–30) of MGP, BMP4, EC markers VE-cadherin (VE-cad) and CD31, osteogenic markers Cbfa1 and Osterix (OSX), and multipotency markers Nanog, Sox2 and Oct3/4. The expression was compared to that on P2. Scale bars, 100 μm.