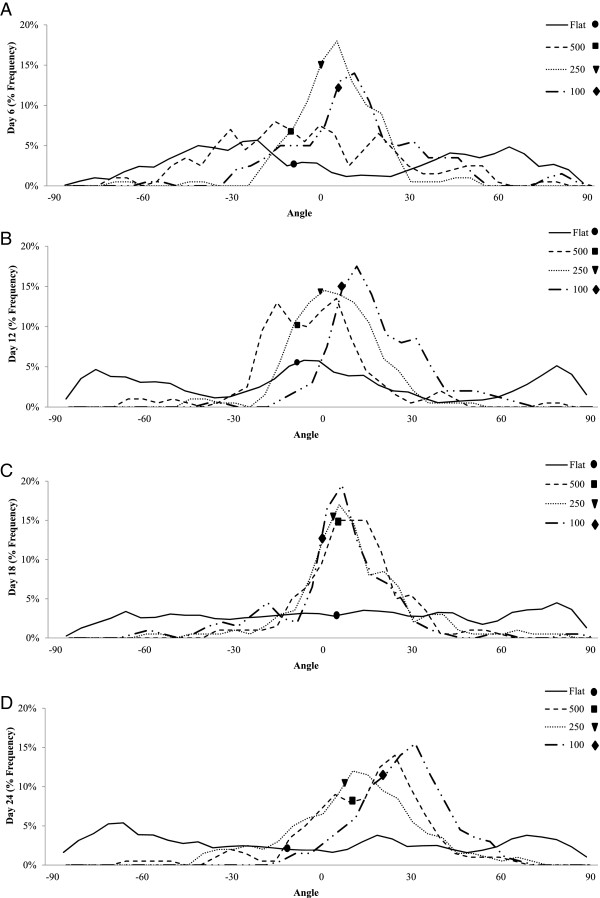
Figure 9.
Frequency distribution of the cell angles during the four time points. The dots represent the median angle of orientation for each group. This graph shows the early stages of cell organization following cell attachment and early differentiation. In the control flat group the cells appear to be very disorganized and are scattered in every position. Overall all of the experimental groups showed higher organized than the flat control groups which remained disorganized for the entire 24 days (significantly higher variance#). At day 6 (A) the 250mc group shows earlier orientation than the rest of the groups#, followed by the 100mc group. The 500mc group does not quite achieve early organization. By day 12 (B) the 100mc group gains the most organization* followed by the 250mc and the 500mc group. The 500mc group reaches organization by this time. At day 18 (C) the most organized groups remain the 100mc and the 250mc^. The 500mc becomes even more organized as well. At the very last time point (D) we see the 100 group that shows higher organization than the rest of the groups (P < 0.001), followed by the 250mc and 500mc which show no difference from one another.* P < 0.05; ^ P < 0.01; # P < 0.001.

