
Figure 3.
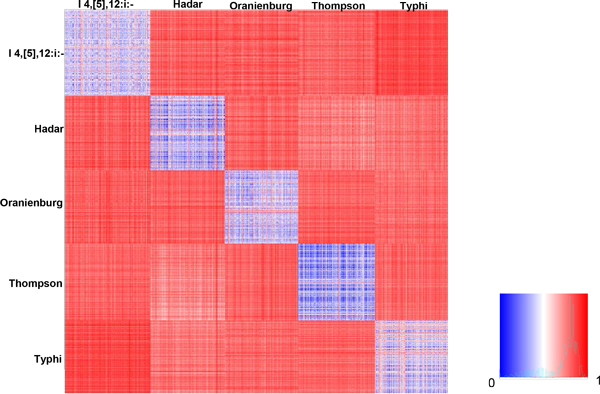
Distance matrix of five selected serotypes. The heatmap shows the distances matrix presenting the dissimilarities for any two patterns in the selected dataset of five serotypes. The dissimilarity of PFGE patterns inter- or intra-serotypes was calculated by Jaccard Distance, and the values ranged from 0 (blue) to 1 (red) (shown in the index).