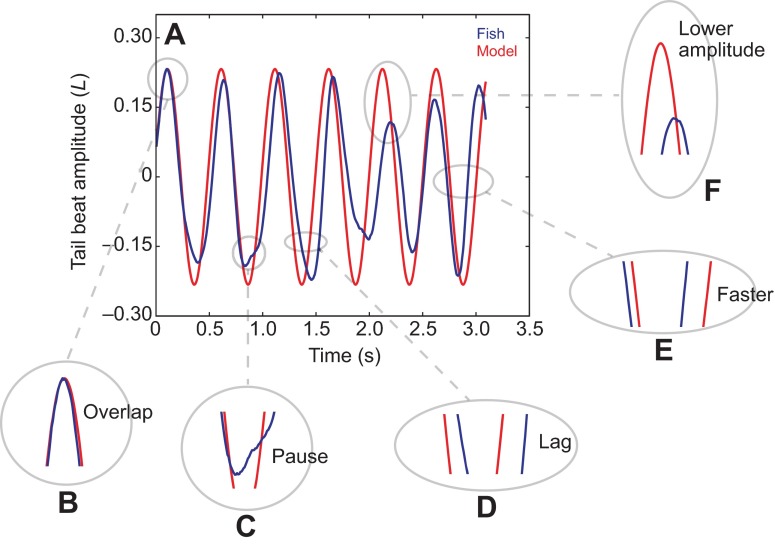
Fig. 11.
(A) Cycle-by-cycle comparison of tail beat amplitude between a fish (red) and the model (blue) for a selected seven tail beat sequences. At times, the fish moved as the model predicted (B, red directly overlapping blue), but not at other times. Several time points show examples of a deviation from the model. (C) Fish interrupted a continuous sweep with a pause. (D) Within a cycle, the fish lagged increasingly behind the model. (E) Fish moved faster than the model predicts. (F) Tail beat amplitude was lower than that of the model.

