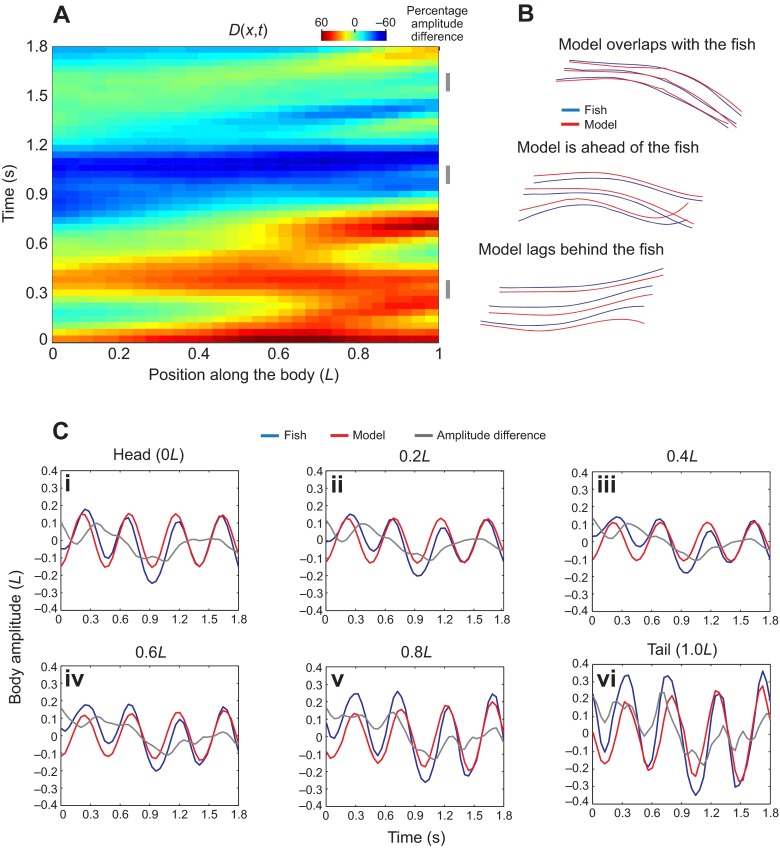
Fig. 4.
Evaluation of the full kinematic model on one representative fish during several tail beat cycles. (A) A residual color map showing the percentage amplitude difference [D(x,t)] between the fish and model midlines across time and position along the body. (B) Series of fish (blue) and model (red) midlines at three selected time points (gray bars in A). (C) Comparison between fish and model motion at six locations along the body (i–vi) show that there is no systematic error between the model and the fish.

