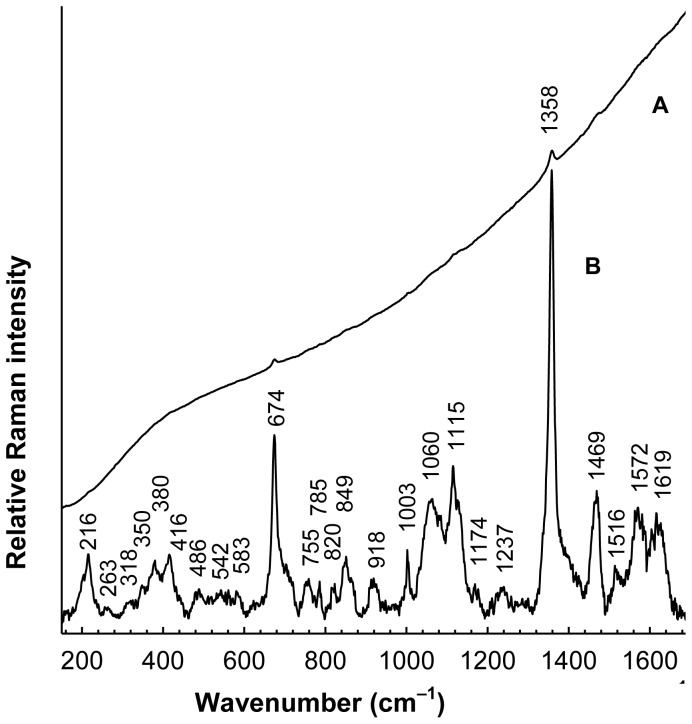
Figure 3. Resonance Raman spectrum of MBP2*- LmbB2.
MBP2*- LmbB2 (trace A) was superimposed on a fluorescence background. Background corrected spectrum (trace B) was expanded 25× to highlight details. Upper part of the background-corrected spectrum exhibited pattern typical for the Soret band-excited RRS spectra of various heme-containing proteins [21], [22].

