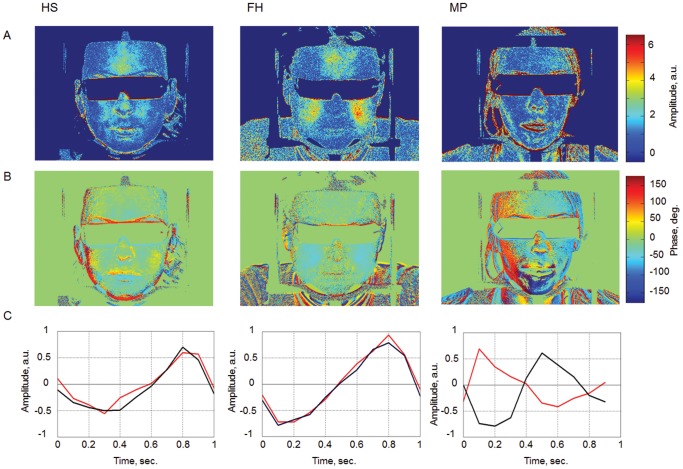
Figure 3. Spatial distribution of facial blood pulsations.
Row A, a 2D map of the blood pulsation amplitude; row B, a 2D map of the blood pulsation phase; row C, evolution of the blood pulsation volume during a single cardiac cycle in the right (black line) and left (red line) cheeks of each subject. Column HS: a healthy subject; column FH: a subject from the group with a family history of migraine; column MP: a subject suffering from migraine (left sided).

