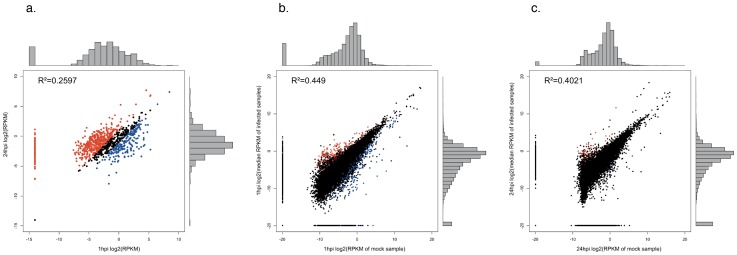
Figure 2. Distribution of RNA-Seq data.
(a) Chlamydia 1 hpi versus 24 hpi. Chlamydial genes above the cutoff of RPKM≥0.1 and a minimum of 10 mapped reads are highlighted in blue and red at 1 and 24 hpi respectively; and host cells at (b) 1hpi relative to mock and (c) 24 hpi relative to mock. Significantly differentially expressed host cell transcripts (FDR≤0.05 and LFC≥2.0) between the mock and infected conditions are plotted in red (up-regulated) and blue (down-regulated). Pearson's correlation (R2) between replicates is indicated for each.

