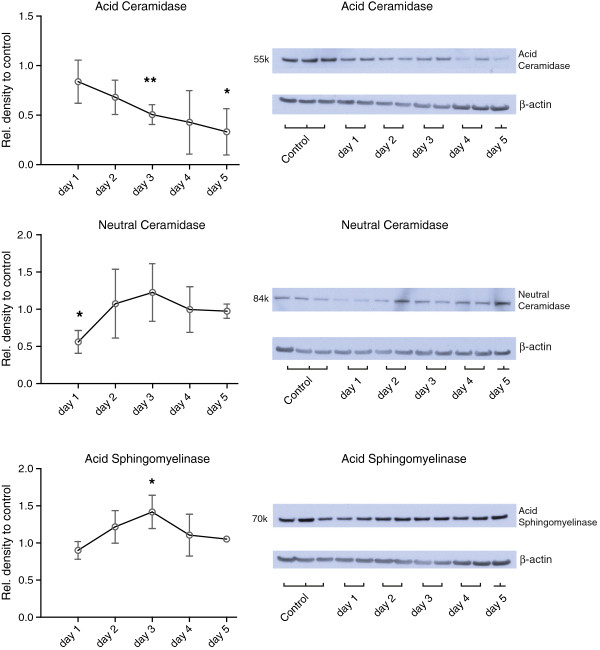
Figure 5.
Densitometric expression analysis of acid sphingomyelinase, acid- and neutral ceramidase proteins accompanied by representative western blots. All data is expressed as mean ± SEM. n=4 for day 1, 2 and 3, n=3 for day 4 and 5. * = p<0.05 and ** = p<0.001 compared to control levels (which were set at 1).

