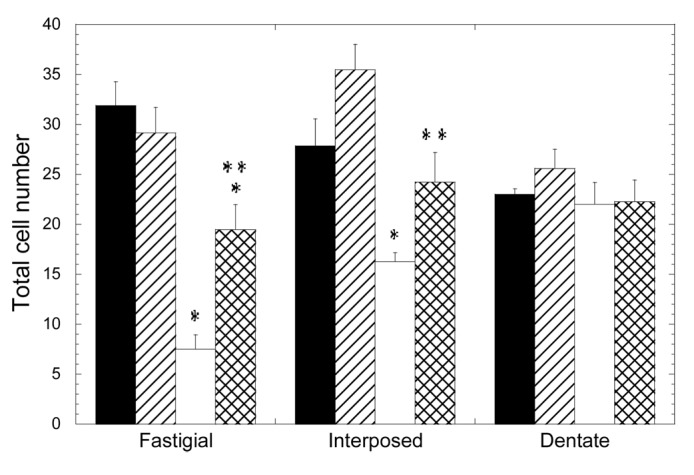
Figure 1. Depletion of deep cerebellar nuclei neurons in the 3xTg-AD mouse cerebellum and recovery by scFv-h3D6 treatment. Cell numbers from fastigial, interposed and dentate nuclei were determined. Black, untreated NTg group; Striped, scFv-treated NTg group; White, untreated 3xTg-AD group; Squared, scFv-treated 3xTg-AD group. Results are expressed by means ± SEM *significant vs untreated NTg group (p ≤ 0.05); **significant vs untreated 3xTg-AD group (p < 0.03). Significance values were calculated via Mann-Whitney test.
