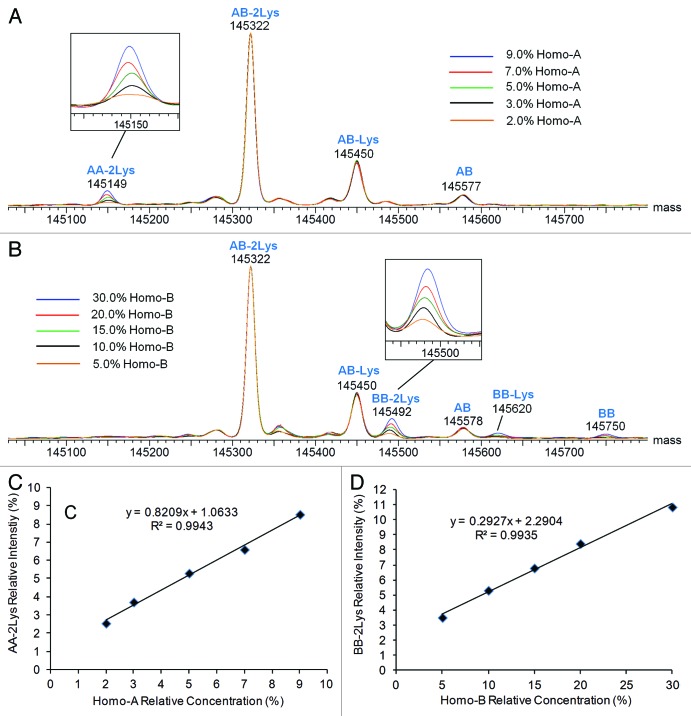
Figure 7. Deconvoluted mass spectra (intact antibody charge envelope) and homodimer intensity response curves for Hetero-AB mixed with varying amounts of Homo-A or Homo-B standards. (A) Overlaid spectra for Hetero-AB containing Homo-A, normalized to the AB-2Lys peak. (B) Overlaid spectra for Hetero-AB containing Homo-B, normalized to the AB-2Lys peak. (C) Plot of AA-2Lys intensity (relative to the sum of AA-2Lys and AB-2Lys intensities) vs. Homo-A relative concentration. (D) Plot of BB-2Lys intensity (relative to the sum of BB-2Lys and AB-2Lys intensities) vs. Homo-B relative concentration.

An official website of the United States government
Here's how you know
Official websites use .gov
A
.gov website belongs to an official
government organization in the United States.
Secure .gov websites use HTTPS
A lock (
) or https:// means you've safely
connected to the .gov website. Share sensitive
information only on official, secure websites.
