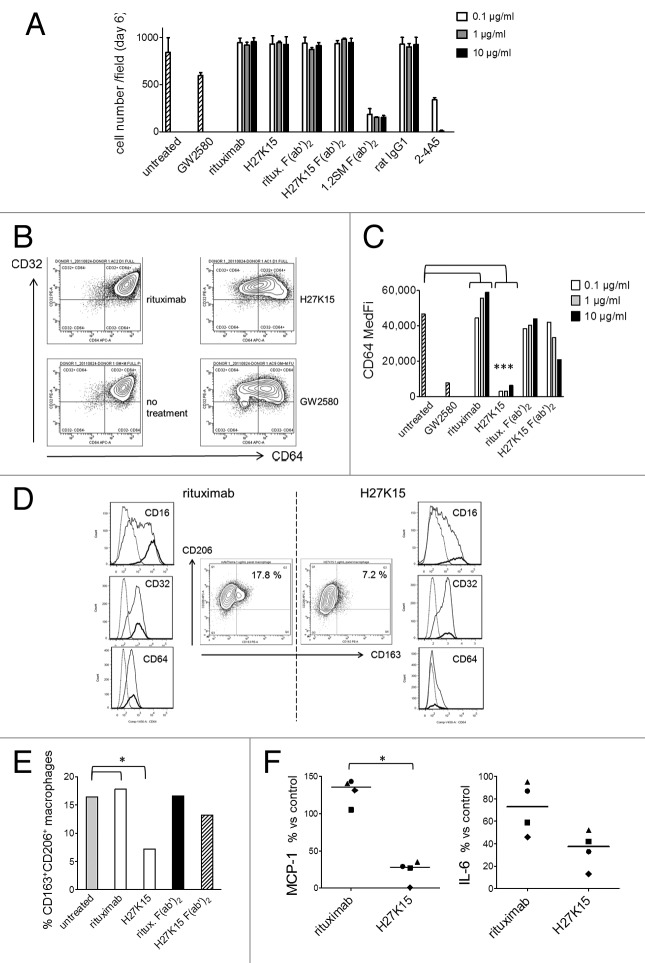
Figure 4. H27K15 is not cytotoxic to monocytes cultured in GM-CSF and CSF-1 but inhibits M2-type macrophage differentiation. CD14+ monocytes were cultured with GM-CSF alone (from day 0 to day 3) and GM-CSF plus CSF-1 (from day 3 to day 6), in the presence of anti-CD115 or control mAbs at the indicated concentrations, F(ab’)2 at corresponding equimolar concentrations (0.06, 0.6 or 6 µg/ml) or the CD115 tyrosine kinase inhibitor GW2580 at 1 µM. (A) Macrophage viability after 6 d. Shown are the mean cell counts in 3 wells ± SD obtained in each culture condition from one representative blood donor. (B) Inhibition of CD64 expression after monocyte differentiation in the presence of mAb H27K15 (10 µg/ml) or GW2580, compared with their respective negative controls rituximab or no treatment. Dot plots represent CD64 and CD32 staining of live cells derived from one blood donor representative of 4 tested. (C) Medians of CD64 fluorescence intensities in monocyte differentiated from the same donor in the presence or absence of GW2580, H27K15 or rituximab (both at 0.1, 1 or 10 µg/ml), or their derived F(ab’)2 at equimolar concentrations. * Mann-Whitney’s two-tailed test p = 0.029 (n = 4 donors) between CD64 MFI with mAb H27K15 / CD64 MFI in untreated culture compared with rituximab. (D) Middle panels: Dot plots represent CD163 and CD206 surface expression in monocytes differentiated with GM-CSF and CSF-1 in the presence of either H27K15 or control rituximab (1 µg/ml). Resulting percentages of CD163+ CD206+ cells are indicated. Histogram overlays of CD16, CD32 and CD64 fluorescence in the live cell population (plain lines) and in the CD163+ CD206+ (bold lines) subpopulation are shown for H27K15- (right) or rituximab-treated (left) cultures. Dotted lines: isotype controls. Data obtained from one blood donor representative of 4 tested. (E) Percentages of CD163+ CD206+ macrophages in cultures from the same donor after differentiation in the presence of H27K15 or rituximab (1 µg/ml), or the corresponding F(ab’)2 (0.6 µg/ml), or no reagent. * Mann-Whitney’s two-tailed test p = 0.029 (n = 4 donors) between % CD163+ cells with mAb H27K15 / % CD163+ cells in untreated culture compared with rituximab. (F) MCP-1/CCL2 and IL-6 were titrated in culture supernatants from monocyte-derived cells from 4 different blood donors after a 6-d culture with GM-CSF and CSF-1 in the presence of mAb H27K15 or isotype control rituximab (both at 1 µg/ml). Shown are the median percentages of variation in MCP-1/CCL2 (left) or IL-6 (right panel) produced in rituximab- or H27K15-treated cultures vs untreated cultures. *Mann-Whitney’s two-tailed test p < 0.05 between MCP-1 production with mAb H27K15 / MCP-1 production in untreated culture compared with rituximab.

An official website of the United States government
Here's how you know
Official websites use .gov
A
.gov website belongs to an official
government organization in the United States.
Secure .gov websites use HTTPS
A lock (
) or https:// means you've safely
connected to the .gov website. Share sensitive
information only on official, secure websites.
