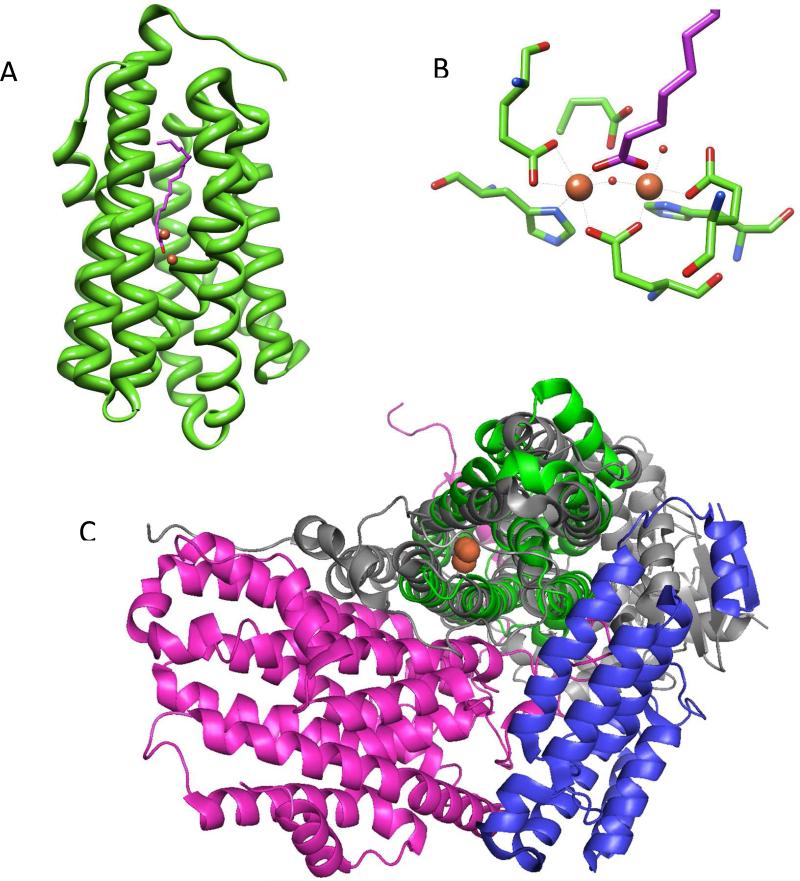
Figure 3.
A Crystal structure of cADO (pdb 2OC5) from P. marinus. The iron atoms of the di-iron center are shown in orange and the co-crystallized fatty acid is shown in purple. B – Detail of the active site of cADO showing the ligands to iron. C – Comparison of the structures of cADO and MMOH (pdb 1XVC). The structure of cADO, shown in green, is overlaid on the α subunit of MMOH, shown in gray. The additional β and γ subunits of MMOH are shown in pink and blue; the di-iron centers of both enzymes closely overlay and are shown in orange. Figures 3A and 3B are based on reference 30.

