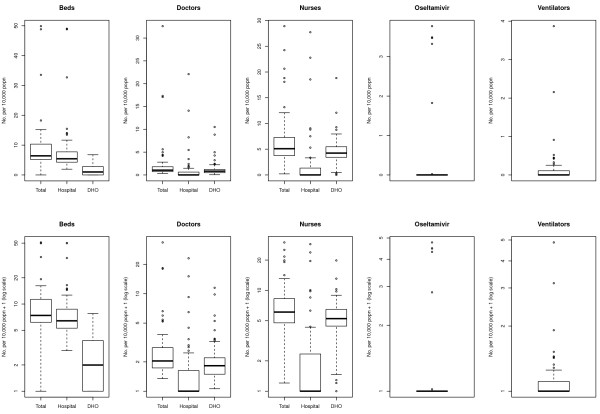
Figure 2.
Availability per 10,000 population of key healthcare resources for responding to pandemic influenza across Operational Districts in Cambodia. Boxes represent the interquartile range with the median denoted by the heavy line. Whiskers represent upper and lower outliers within 1.5 times the interquartile range.

