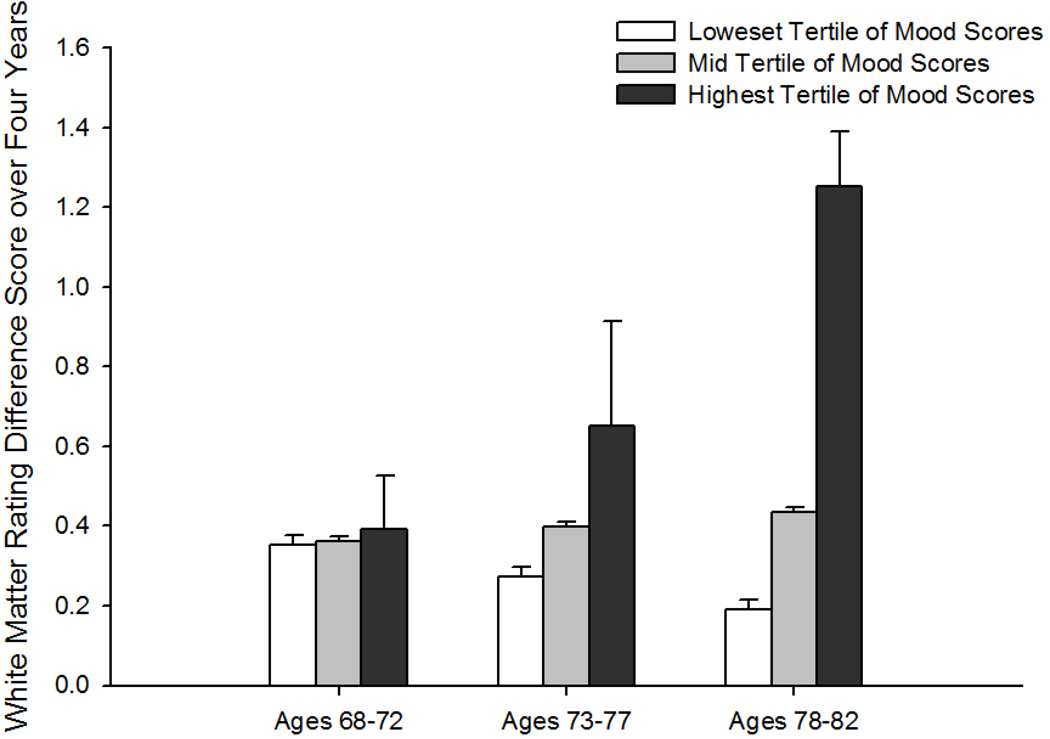
Figure.
Change in white matter hyperintensity rating over 4 years as a function of Center for Epidemiologic Studies Depression Scale (CES-D) depressed mood subscale scores. Depressed mood groups are based on tertile cutoffs. White bars = lowest CES-D depressed mood subscale tertile (average score <.25); gray bars = middle CES-D depressed mood subscale tertile (average score <1.5); black bars = highest CES-D depressed mood subscale tertile (average subscale score >=1.5). The depressive symptoms and age groupings depicted in the figure are for ease of display only as depressive symptoms and age were continuous variables in all analyses.

