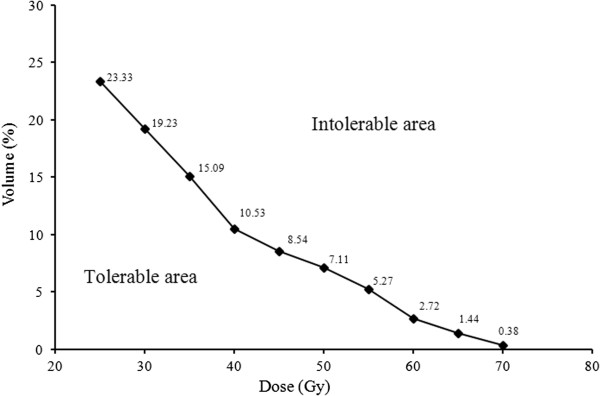
Figure 1.

Temporal lobe (TL) irradiation tolerance curve expressed as a cumulative dose-volume histogram. The histogram was created using the cutoff points in Table 3. The area under the dose–volume histogram curve was assumed to be tolerable, and the area over the curve, intolerable. The sensitivity and specificity for prediction of TLI ranged from 0.70 to 0.85, and 0.80 to 0.85 (see Table 3).
