Figure 3.

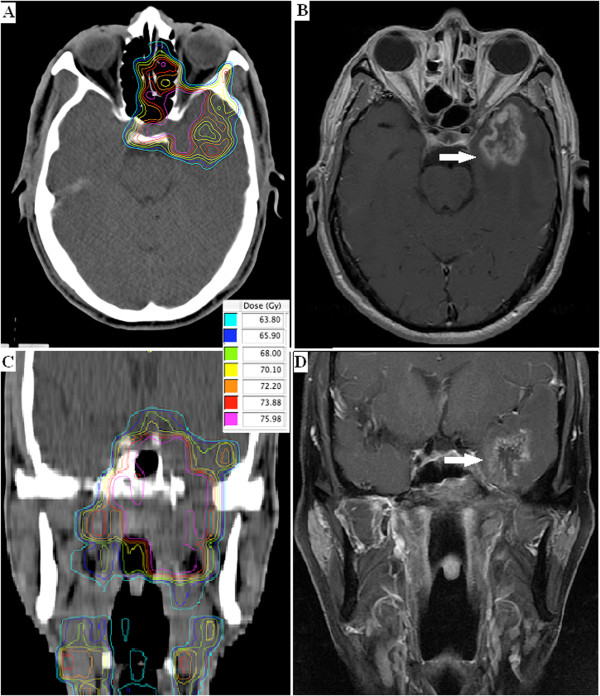
Dose distribution and corresponding necrosis nidus within the temporal lobes (arrow). Axial (A and B) and coronal (C and D) MRI images of a 62-yr-old NPC patient (patient 1 in Table 1).

Dose distribution and corresponding necrosis nidus within the temporal lobes (arrow). Axial (A and B) and coronal (C and D) MRI images of a 62-yr-old NPC patient (patient 1 in Table 1).