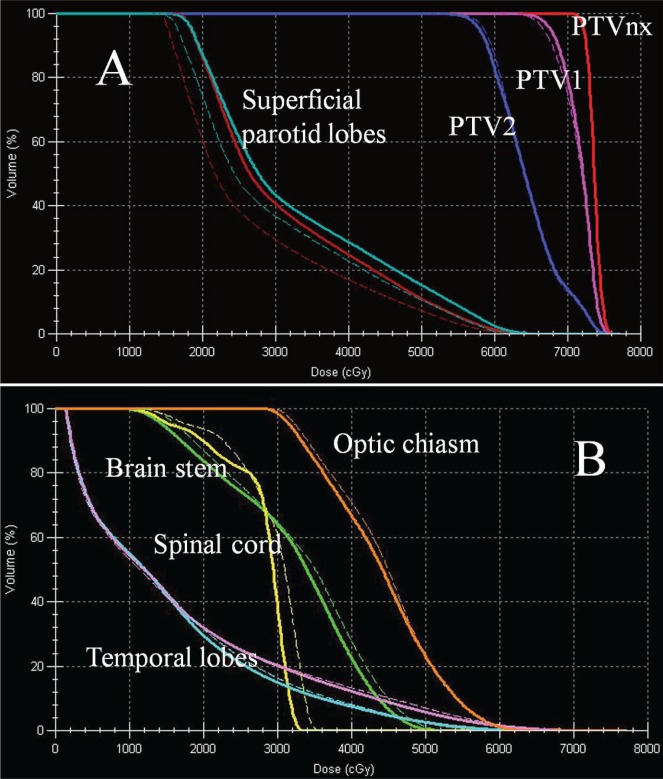
FIGURE 4.
Dose–volume histogram for changes in target and organs at risk for a patient with T3N1M0 nasopharyngeal carcinoma. Dotted lines represent test plans, solid lines represent control plans. (A) The mean doses to the left and right superficial parotid lobes decreased significantly, with no significant change in target regions. ptv = planning target volume. (B) Doses to some organs at risk, such as the brainstem and spinal cord, showed small increases, but were within the prescription.

