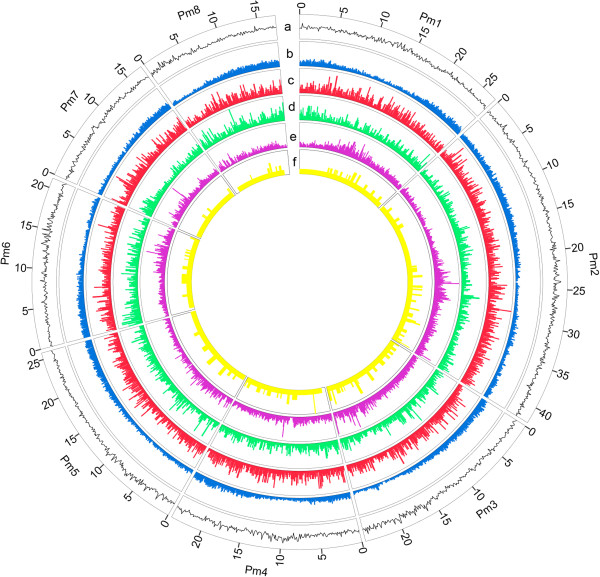
Figure 2.
Distribution of polymorphic DNA markers between ‘Fenban’ and ‘Kouzi Yudie’ in the mei pseudo-chromosomes. All tracks are plotted in 100 Kb windows. The y axis ranges from 0 to 100%. (a) GC content shown in black; (b) Gene density shown in blue; (c) SSR density shown in red; (d) InDel density shown in cyan; (e) SNP density shown in purple; (f) Numbers of SNPs validated in a SNP array, shown in yellow.

