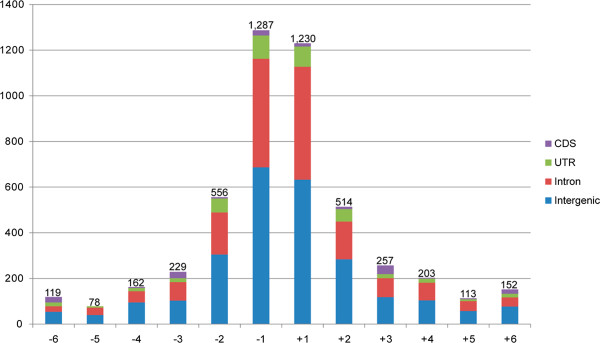
Figure 6.

Distribution of the length of InDels in mei genome. The x-axis indicates the number of nucleotides of insertions (+) and deletions (−). The y-axis indicates the number of InDels at each length in the CDS, UTR, intron, and intergenic regions.
