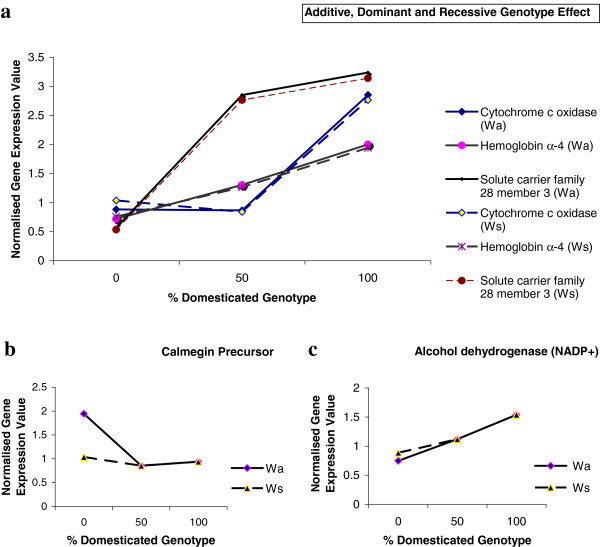
Figure 6.
Representative mRNAs showing the influence of domesticated genotype on normalised gene expression. Strains are pure wild (0%), wild-domesticated hybrids (50%) and pure domesticated (100%). Expression values for both Wa (solid line) and Ws (dashed line) are shown. a) illustrates examples of additive (hemoglobin subunit alpha-4), D-dominant (solute carrier family 28 member 3) and D-recessive (cytochrome C oxidase subunit 4 isoform 2) genotypic effect. Data for Ws fish in 6a, (only) has been shifted (3%) for clarity. b) illustrates the effect of fish stage and gives an example of a mRNA that showed D-dominant (Wa) or no effect (Ws) of domestication depending on whether Wa or Ws is considered, respectively. c) gives an example of a mRNA that showed no significant difference of hybrid from both parental strains but when analysed using regression analysis was classified as resembling additive effect. The standard error of the mean for this data ranged from 0.004 - 0.564.

