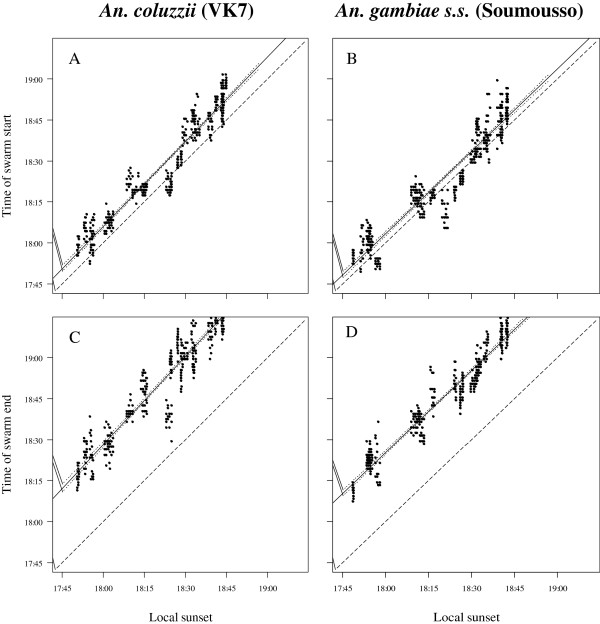
Figure 5.
Regression of time of swarming on time of sunset for Anopheles coluzzii in VK7 and An. gambiae s.s . in Soumousso. A)An. coluzzii start of swarming, B)An. gambiae s.s. start of swarming, C)An. coluzzii end of swarming and D)An. gambiae s.s. end of swarming; solid line = regression, fine dashed line = 95% confidence interval of the regression and coarse dashed line = 1:1 slope for time of sunset (i.e., the distance between this line and the regression line indicates the time after sunset at which swarming started or ended) and n = 240 for each of the four plots.

