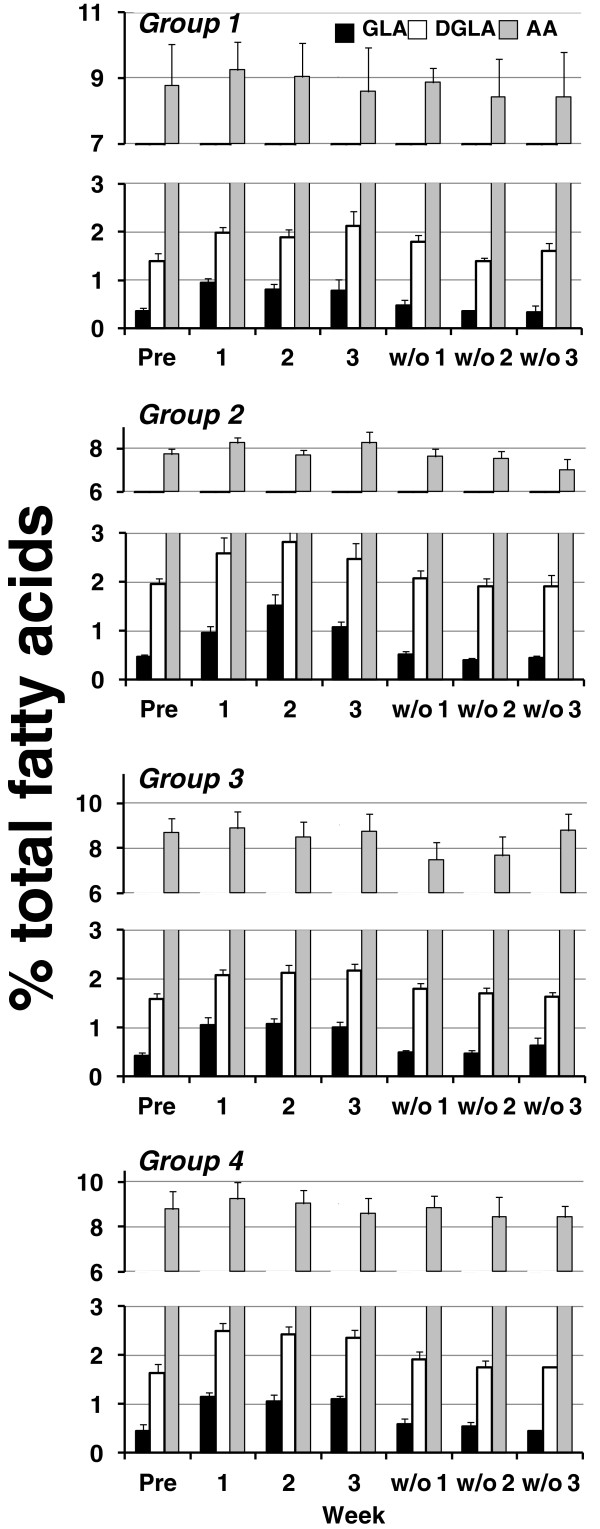
Figure 3.
Effects of dietary supplementation with borage and echium seed oils on concentrations of plasma n-6 fatty acids. Data are expressed as a percentage of total plasma fatty acids and are shown for GLA (black bars), DGLA (white bars), and AA (gray bars). Fatty acid profiles were monitored during the time course of the study beginning at baseline (Pre), during supplementation (weeks 1–3) and during the washout phase (w/o1-3). Data are mean ± SEM for each group. Statistically significant rises in GLA and DGLA were noted over time (p < 0.0001) with no statistically significant differences among groups.

