
Figure 2.
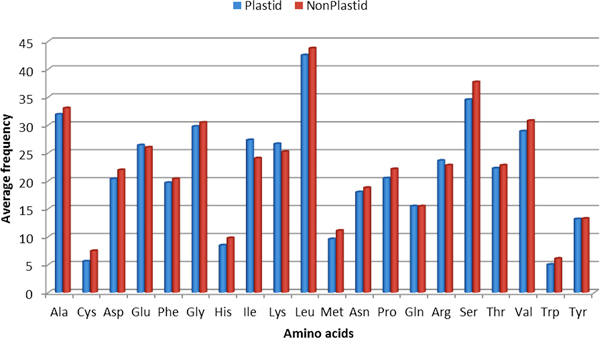
A comaprative bar-graph of amino acid composition differences in plastid and non-plastid proteins.
Official websites use .gov
A
.gov website belongs to an official
government organization in the United States.
Secure .gov websites use HTTPS
A lock (
) or https:// means you've safely
connected to the .gov website. Share sensitive
information only on official, secure websites.
A comaprative bar-graph of amino acid composition differences in plastid and non-plastid proteins.