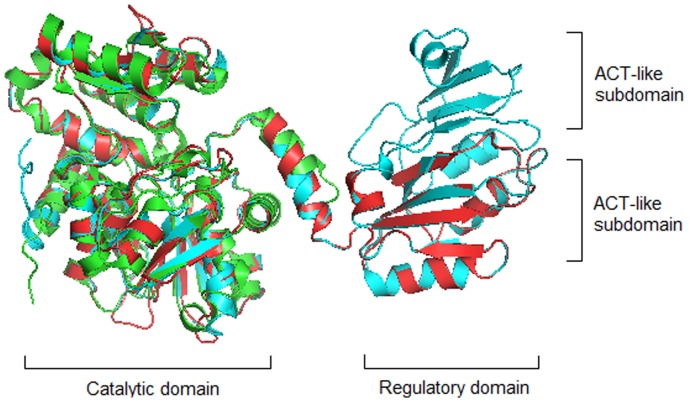
Figure 1. Structure comparison of BTD2 (1TDJ) in E. coli, BTD1 in B. subtilis and CTD (2GN2) in S. typhimurium.
Two domains in BTD1 and BTD2 are separated by a middle linker. The larger domain on the left is the catalytic domain, and the smaller one on the right is the regulatory domain composed of ACT-like subdomains. CTD (shown in green) contains only the catalytic domain; BTD1 (shown in red) contains the catalytic domain and one ACT-like subdomain; BTD2 (shown in blue) contains the catalytic domain and two ACT-like subdomains.

